
Odoo 19 introduces useful updates to spreadsheets, making them smarter, more flexible & easier to use for business reporting. Odoo 19’s spreadsheet module now introduces latest features like advanced chart types, more formula support & better integration across modules. Whether it’s tracking survey responses, analyzing regional data, or managing reports on the go, the spreadsheet module in Odoo 19 is designed to give users more control and clearer insights.
‣ New Chart Types in Odoo 19
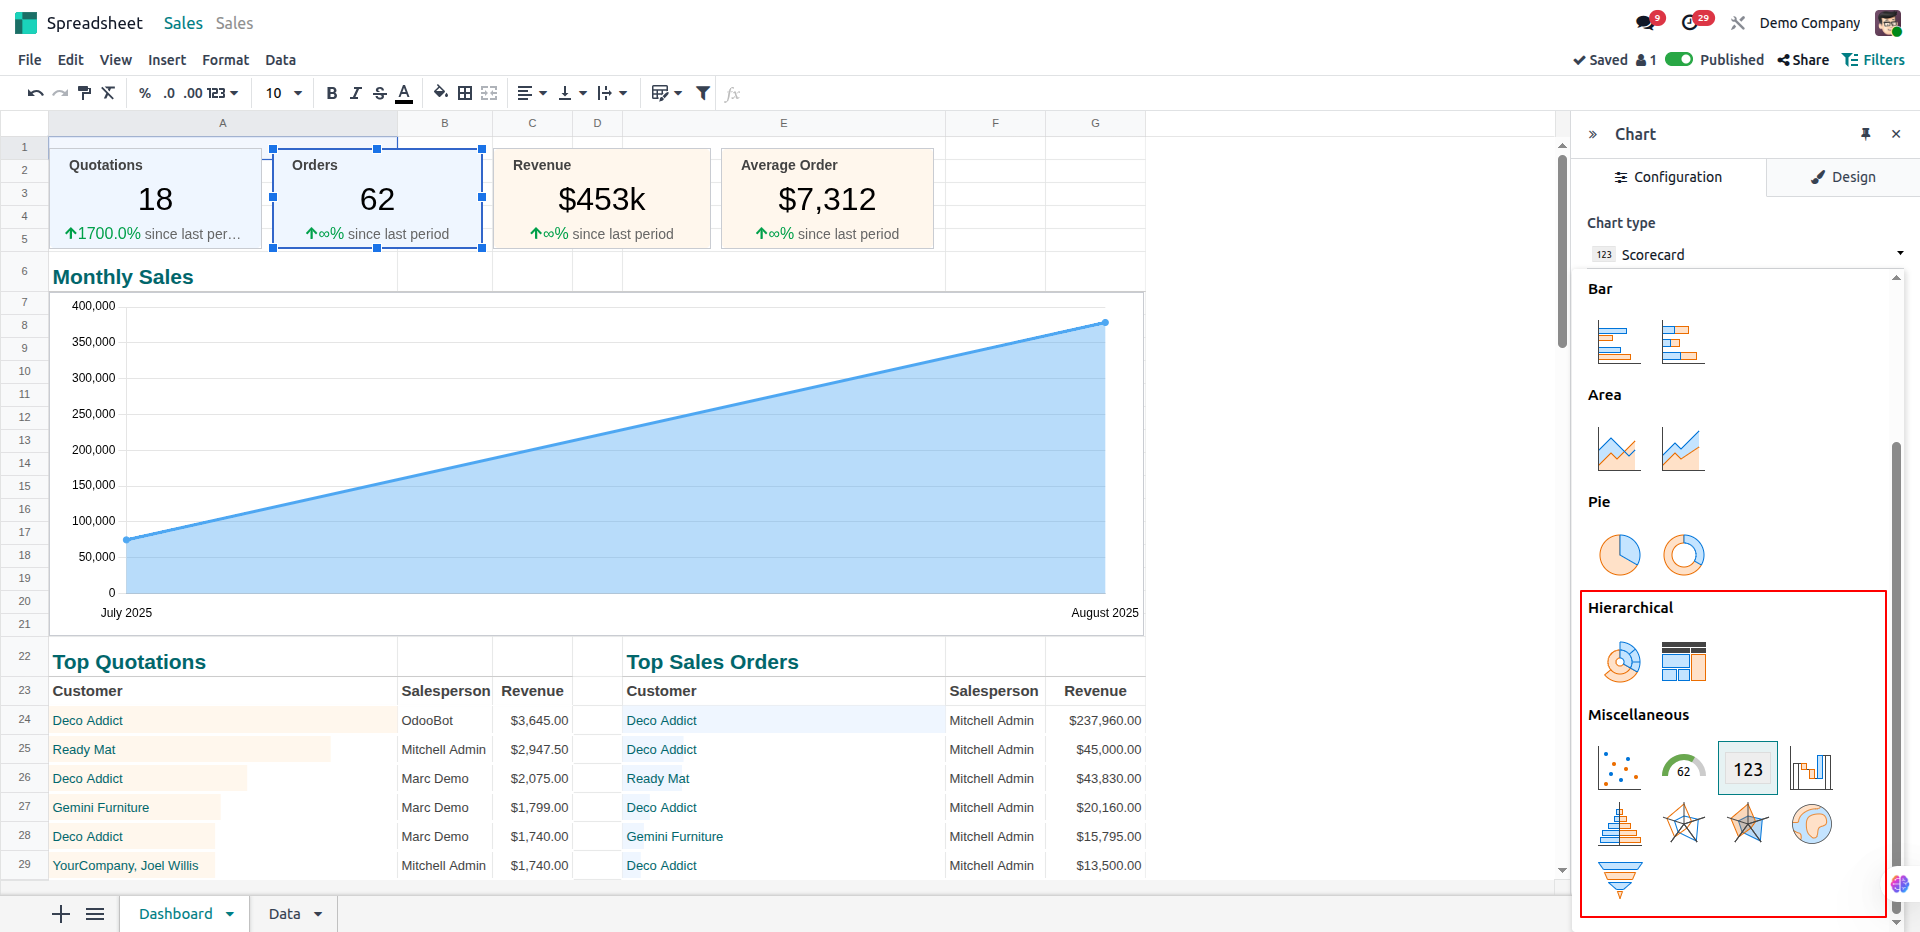
Odoo 19 introduces several advanced chart types that were not available in Odoo 18, enhancing data visualization capabilities within spreadsheets:
- Treemap Chart
Displays hierarchical data using nested rectangles, making it easy to visualize part-to-whole relationships in large datasets. - Sunburst Chart
A circular hierarchical chart with concentric rings representing different levels of data hierarchy, ideal for displaying multi-level categories interactively. - Spider or Star Chart
Displays multivariate data on a circular layout, useful for comparing multiple variables across entities. - Radar Chart (with filled area variation)
Similar to the spider chart but with the area inside data points filled, improving visual comparisons. - Map Chart
Geographical representation of data on maps, enabling regional analysis and distribution visualization.
‣ Improved Formula Functionality with ODOO.LIST
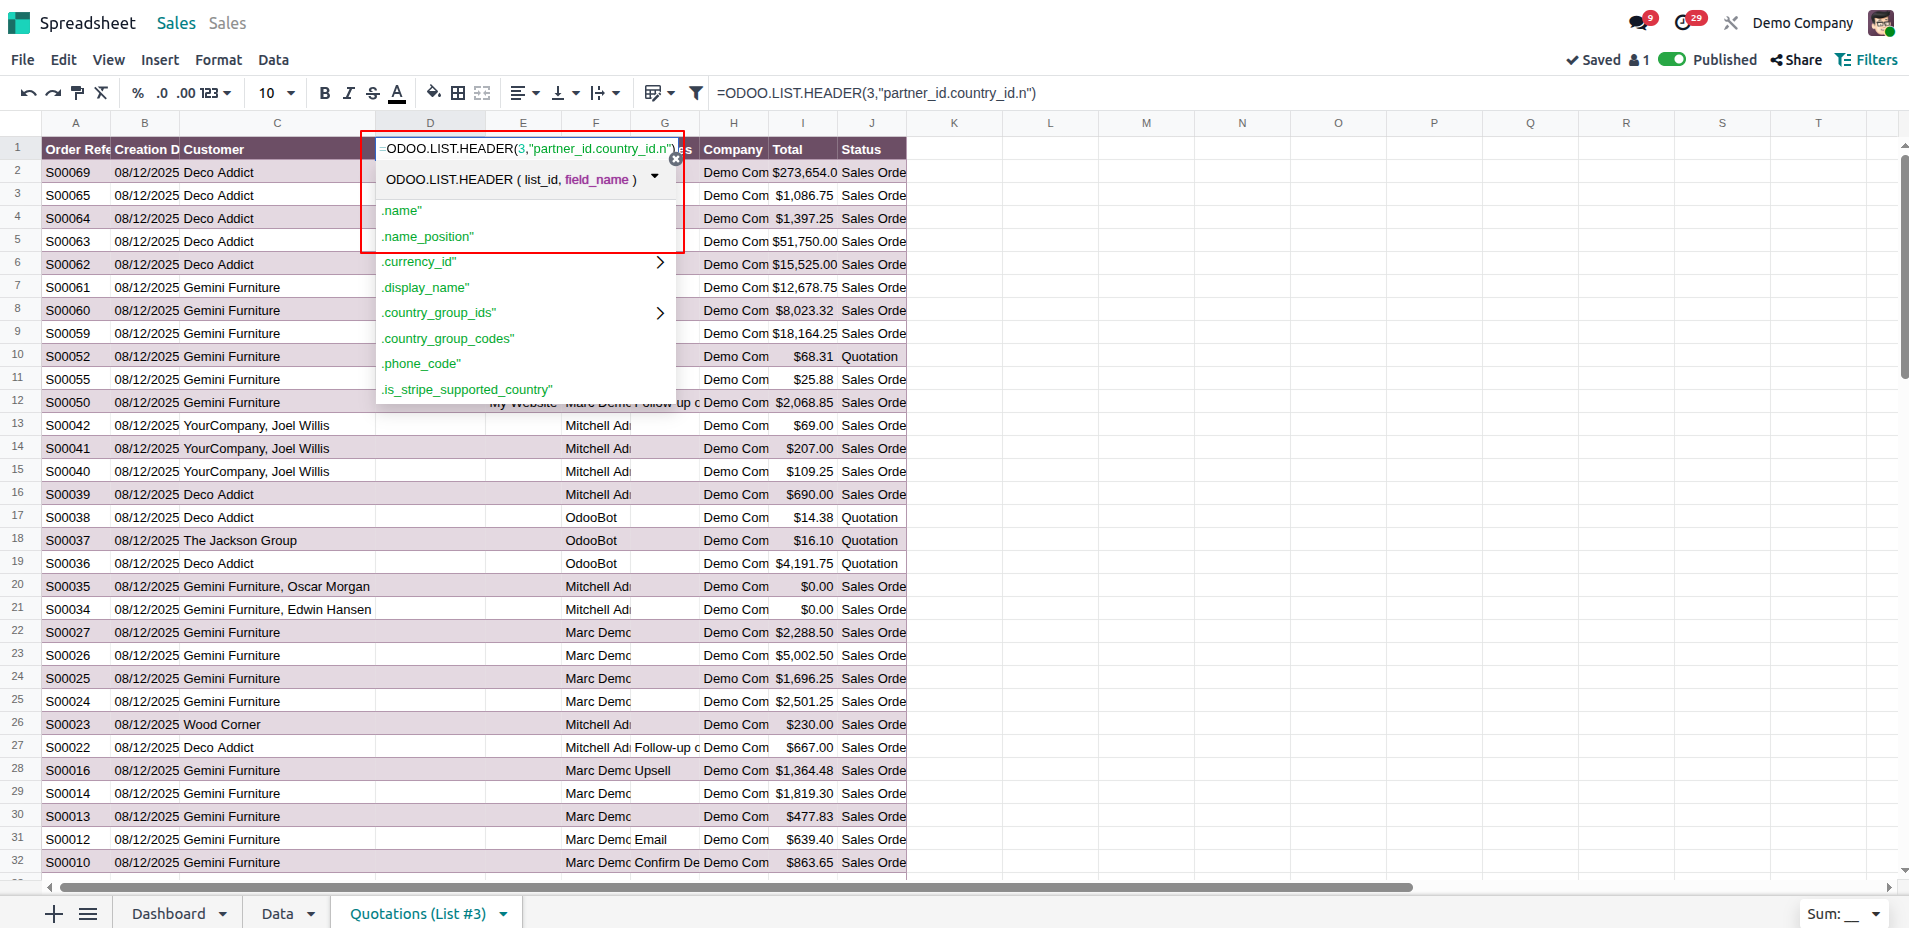
In Odoo 19, =ODOO.LIST(5,2,"partner_id.country_id.name") this formula works properly, enabling users to extract and list nested relational data directly in spreadsheets. This improvement enhances data integration across modules and supports more complex data analysis workflows directly within the spreadsheet environment.
‣ New Formula: ODOO.SURVEY in Odoo 19
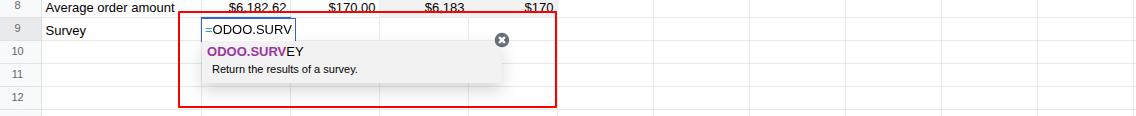
- The formula =ODOO.SURVEY is newly introduced in Odoo 19.
- This formula connects the spreadsheet data with the Odoo Survey module and helps to get responses, allowing dynamic inclusion, analysis & reporting on survey data within spreadsheets.
- This functionality enables businesses to analyse deeper insights directly within their spreadsheet reports, improving decision-making processes that incorporate customer and employee feedback without switching platforms.
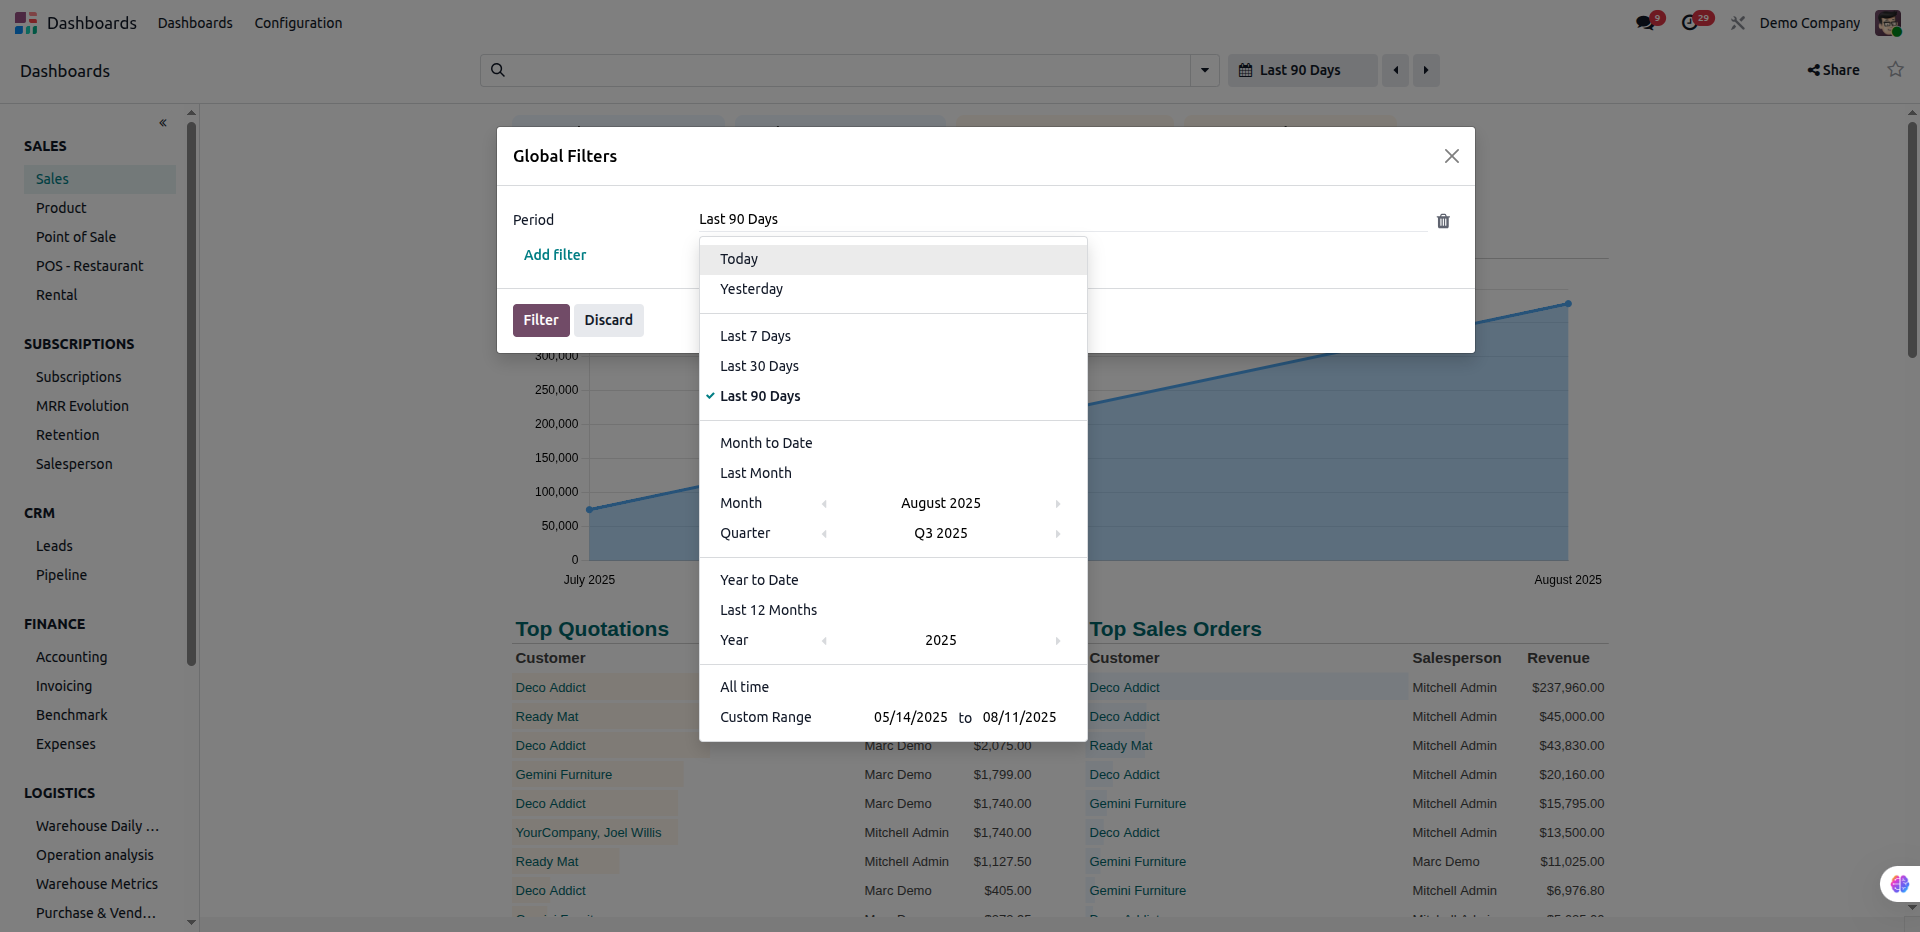
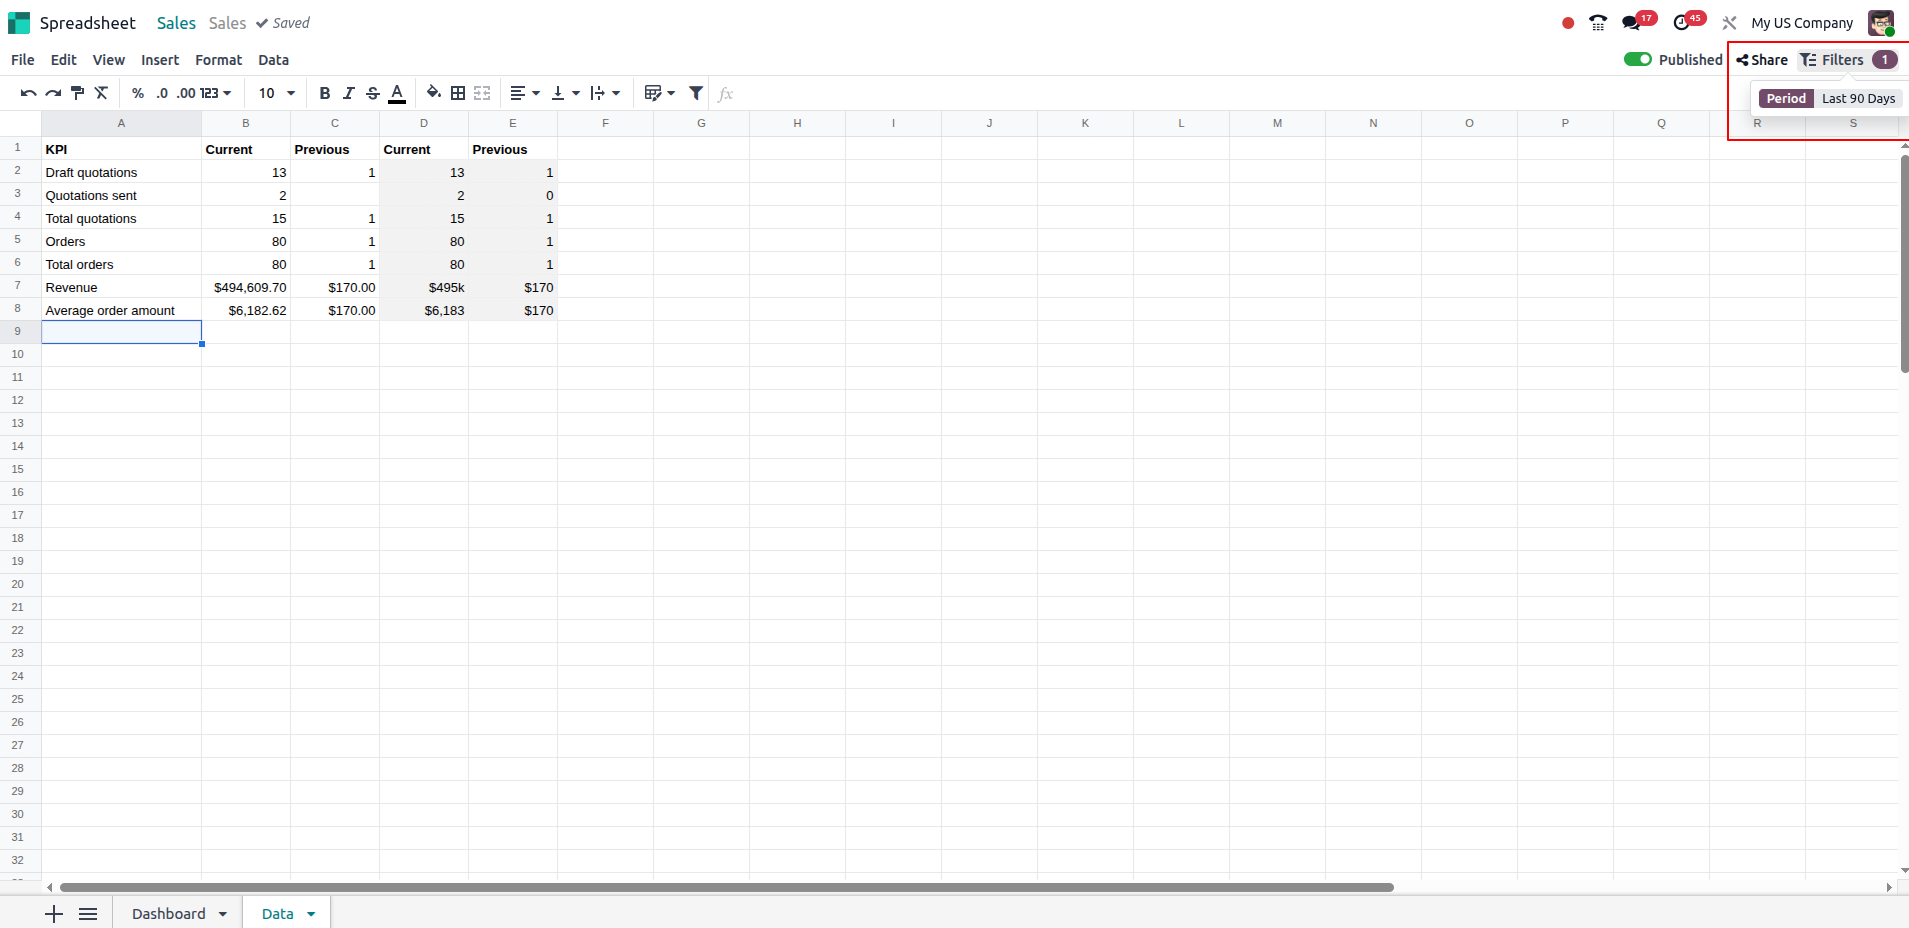
‣ Date filters and additional time periods
The Spreadsheet and Dashboard tools include an improved date filter panel that enables quicker comparisons and richer time presets for analysis.
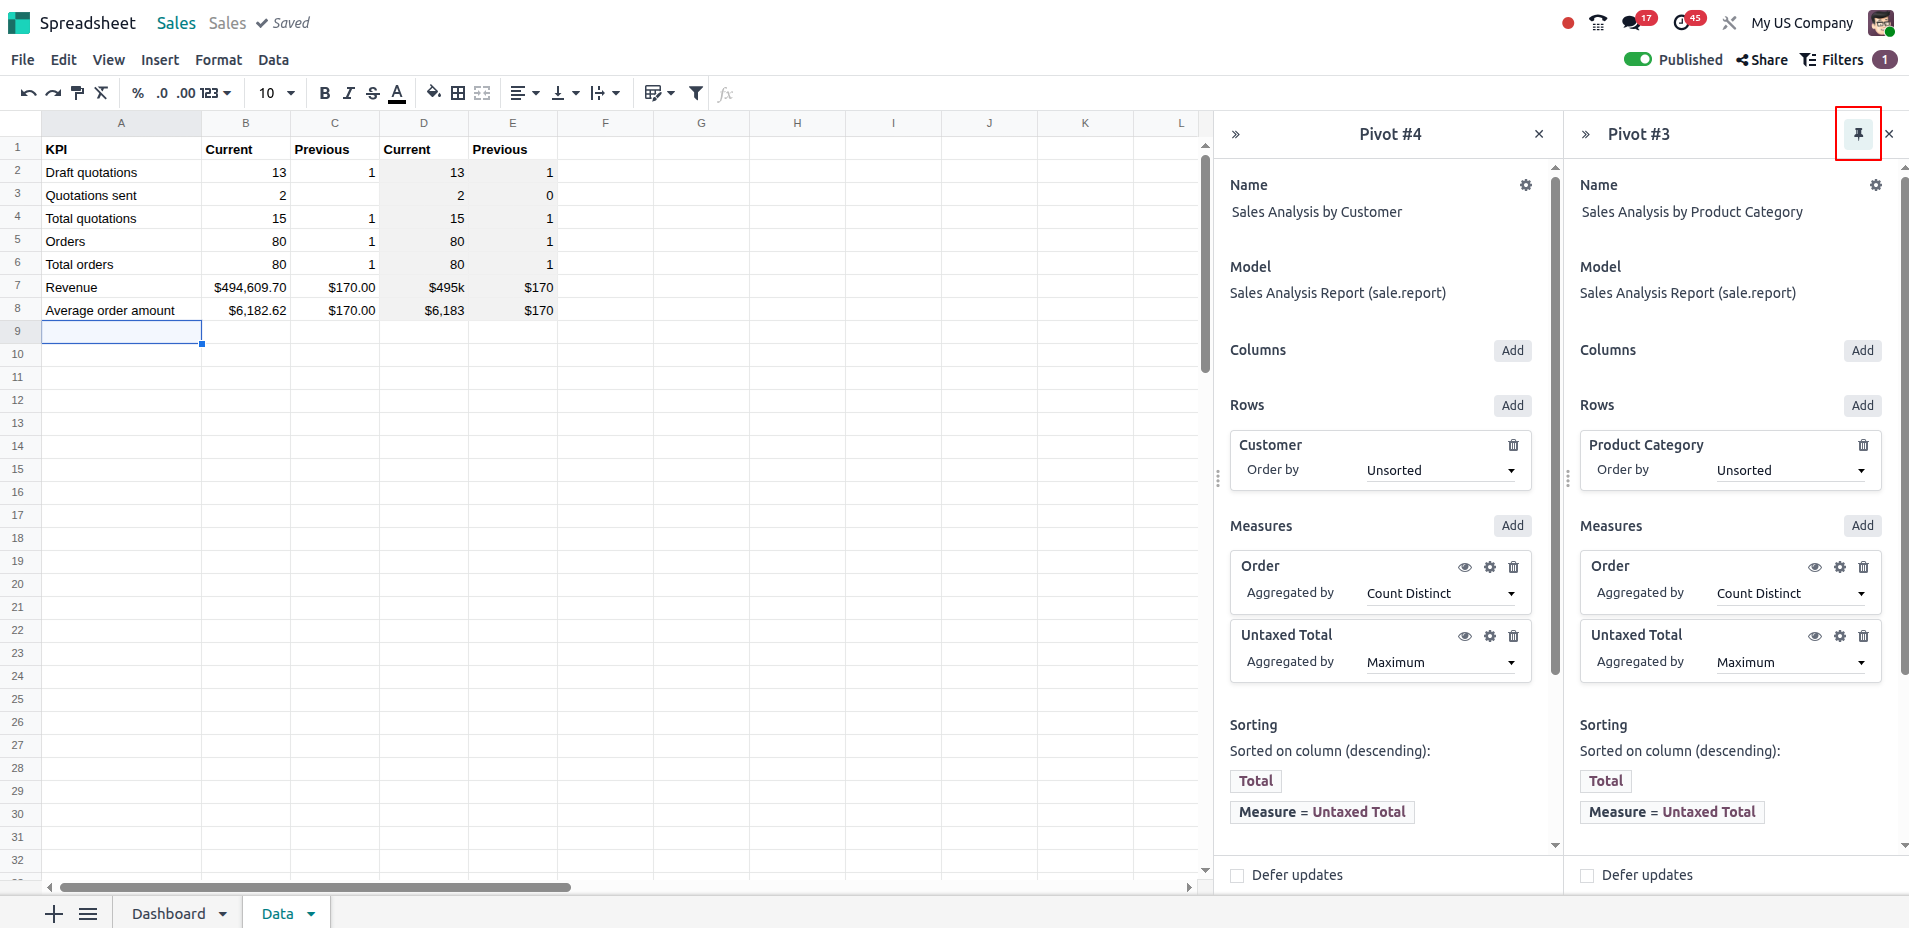
‣ Pin side panels and display up to two of them at the same time.
Pinned side panels stay visible during navigation, making multi-step edits faster. You can also open two panels side-by-side to adjust related settings without switching back and forth.
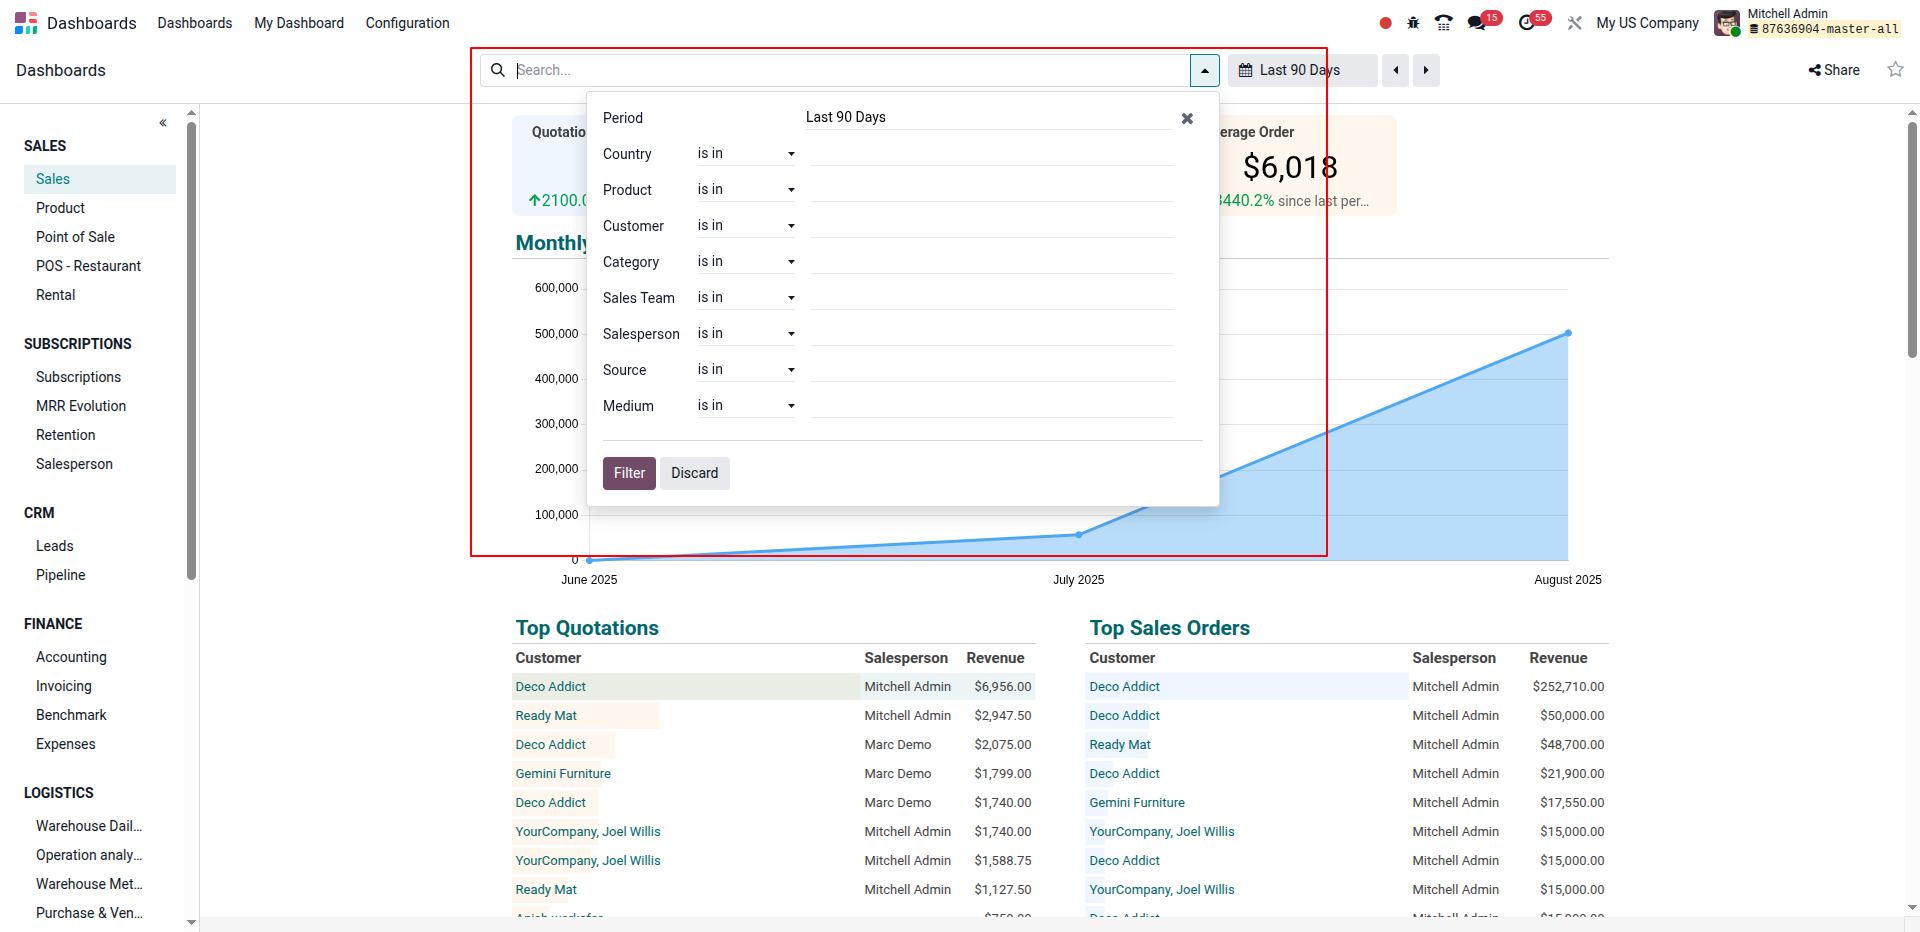
‣ Global filter suggestions
Global filter suggestions are automatically generated based on spreadsheets' data sources.
‣ Text Global filters: Multiple Values
Add multiple values in global filters.
‣ Spreadsheet on Mobile devices
Spreadsheet now available on mobile devices.
‣ Pivot Collapse Rows and columns
Collapse rows and columns in dynamic pivots.
‣ Conclusion
The improvements in Odoo 19 turn spreadsheets into a practical tool for day to day business decisions. With updated features like charts, updated formulas, global filters, and mobile support, users can create reports that are both powerful and easy to implement. These updates help businesses save time, improve collaboration, and get more value from their data, contact us via contact@serpentcs.com to know more about odoo implementation plans and more support.